Plates/Shells - Modeling Examples
The finite element method is an approaching method. This means that the results will never be exact and can be made better and better, within reason, by sub-dividing the element mesh. Accurate results are dependent on the modeling of the problem.
The following pages are studies of finite element mesh fineness and its relationship to accurate stress and deflection results. These studies are meant to be an aide to help you select appropriate mesh fineness for a structure you are trying to model. These studies will also answer the "why" many people ask when told they must use a "mesh" of elements to model a structural item (such as a shear wall) instead of using one giant element. Obviously these studies only give an overview of some basic elements and the engineer must be the final judge as to whether a specific finite element model is a good reflection of the "real" structure.
Shear Wall Modeling
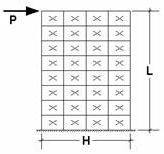
Theoretical Deflection of Shear Wall with Point Load
|
|
Shear Wall Properties L = 240 in Area = 1440 in2 B = 12 in H = 120 in. E = 4000 ksi n= 0.30 G = 1538.5 ksi
P = 15,000 kip |
I = BH3/12 Δ = PL3/3EI + K = P / Δ |
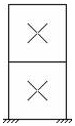
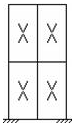
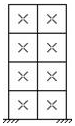
Stiffness as a Function of Mesh Fineness
|
|
|
|
|
|
|
|---|---|---|---|---|---|
|
Element Mesh |
1x1 |
1x2 |
2x2 |
2x4 |
4x8 |
|
Deflection (in.) |
4.54 |
8.07 |
8.26 |
10.43 |
11.2 |
|
Error |
62% |
33% |
31% |
13% |
6% |
|
Stiffness K (kip s/in) |
3304.0 |
1858.7 |
1816.0 |
1438.2 |
1328.6 |
Shear Wall Design Forces
|
Floor |
Shear |
Moment |
Elements |
|---|---|---|---|
|
4 |
9.99k |
100.05k-ft |
P49-P52 |
|
3 |
20k |
300.08k-ft |
P33-P36 |
|
2 |
30k |
600k-ft |
P17-P20 |
|
1 |
40k |
999.98k-ft |
P1-P4 |
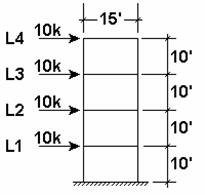
Shown above are the analysis results of a 4-story shear wall. This example is for a straight shear wall, however the method and results are valid for box, channel, or any other shear wall shapes.
The RISA-3D files that were used to obtain these results are included as “4X1WALL.R3D” and “4X4WALL.R3D”. The 10 kip story loads were applied uniformly across each story. This was done to more accurately model loads being applied to the wall from a rigid or semi-rigid floor.
The story shears at each level were calculated as the sum of the FX corner forces. The story moments at each level are calculated from the FY corner forces as shown below:
Mi = (Fyouter
Story Shears - Hand Calculation
The story shears were calculated as shown below from the corner forces. See the screen shot close up of the FX corner forces on the next page.
|
Story |
Sum FX Corner Forcers at Story Level (k) |
Shear |
Moment |
|---|---|---|---|
|
4 |
[0.462 + 0.786 + 1.77 + 1.98] * 2 = 9.996 |
9.9k |
P49-P52 |
|
3 |
[1.2 + 1.65 + 3.45 + 3.7] * 2 = 20.000 |
20k |
P33-P36 |
|
2 |
[1.9 + 2.5 + 5.14 + 5.46] * 2 = 30.000 |
30k |
P17-P20 |
|
1 |
[11.76 – 0.32 + 6.09 + 2.47] * 2 = 40.000 |
40k |
P1-P4 |
|
Level 4 Global FX Corner Forces
Click on image to enlarge it |
For the graphical display of the corner forces, there are 4 corner forces shown for each plate. This is similar to a beam element which has 2 member end forces. To get the story shear at any line, just sum up all the FX corner forces along the line. |

|
Level 4 Global FY Corner Forces
Click on image to enlarge it |
To get the story moment at any line, just sum the moments obtained by multiplying the Fy corner forces along a line, times the moment arm such as the distance of each Fy force to the center of the wall. |

Story Shears - Summation Tool
![]()
Click on image to enlarge it
A quicker way to calculate story forces is to use
the Internal
Force Summation tool to have the program automatically calculate the
global forces that pass through a given elevation of the shear wall. To
do this, just click on the
For additional advice on this topic, please see the RISA Tips & Tricks webpage at risa.com/post/support. Type in Search keywords: Story Shears.
Story Moments
The story moments are calculated as the FY Corner forces times their moment arms. The forces are symmetrical so each force on one side is multiplied by twice the arm length.
|
Story |
Sum FY Corner Forces * Moment Arm (k) |
Story Moment |
Elements |
|---|---|---|---|
|
4 |
[3.92 k * 15' + (2.48 k + 3.02 k) * 7.5'] = 100.05 k' |
100.1 kip-ft |
P49-P52 |
|
3 |
[12.33 k * 15' + (7.9 k + 7.45 k) * 7.5'] = 300.075 k' |
300.1 kip-ft |
P33-P36 |
|
2 |
[24.93 k * 15' + (16.5 k + 13.64 k) * 7.5'] = 600.00 k' |
600 kip-ft |
P17-P20 |
|
1 |
[45.81 k * 15' + (25.16 k + 16.55 k) * 7.5'] = 999.975 k' |
999.9 kip-ft |
P1-P4 |
Shear Wall Penetrations
|
|
|
|
|---|---|---|
|
Horizontal Deflection at Top |
0.028 in. |
0.033 in. |
|
Shear @ A-A |
10.82 kips |
10.53 kips |
|
Shear @ B_B |
24.2 kips |
23.08 kips |
|
Shear @ C_C |
33.74 kips |
33.05 kips |
|
Shear @ D-D |
45.26 kips |
47.35 kips |
|
Reactions at E |
10.8 kips |
10.53 kips |
|
Reactions at F |
24.2 kips |
23.06 kips |
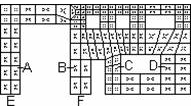
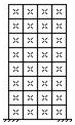
This is an example of a typical concrete shear wall with penetrations for windows and doors of various sizes. The files for the models are WALLPEN1.R3D (coarse mesh) and WALLPEN2.R3D (fine mesh). No theoretical solution results are given to compare with, however the two finite element densities are compared to observe the rate of convergence to the “true” answer. The shears at the various lines are computed by adding up the X corner forces for the element corners closest to the lines. The horizontal deflection is for the top of the wall. A very rigid link is added to the top of the wall to simulate the effect of a concrete horizontal diaphragm. This has the effect of stiffening the walls and spreading the load uniformly across the top of the wall. The load is applied as a uniform load of 3.0 kips/ft. across the top of the wall. The total width of the wall is 38 ft, so the total applied load is 114 kips. The total height of the wall is 18 ft.
The “coarse” mesh on the left is an example of the minimum finite element mesh that should be used to model this type of wall. Notice that the course mesh gives good results for the wall shears and reactions. The overall deflection of the coarse mesh is off by about 15% from the “fine” mesh. The coarse mesh tends to give too much stiffness to the slender walls around the loading door opening on the left, this can be seen in the larger reactions at points E and F as well in the horizontal deflections. The fine mesh on the right shows that the slender wall sections are more flexible than shown by the coarse mesh and thus the reactions and wall shears are reduced for the slender wall sections.
Diaphragm Modeling
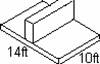
Theoretical Solution for Plate with Fixed Edges
(Results from Roark’s Formulas for Stress and Strain, 5th Ed., pg. 392)
|
|
Plate Properties a = 21 ft. |
Deflection at center
(y): σCenter = β2qb2 / t2 = 6361 psi MCenter
= σCenter(t2/6)(1kip/1000#) σMax = β1qb2 / t2 = 13,231 psi M Max =
σMax (t2/6)(1kip/1000#) |
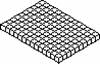
Stiffness and Stress as a Function of Mesh Fineness
|
|
|
|
|
|
|---|---|---|---|---|
|
Element Mesh |
2x2 |
4x4 |
5x5 |
6x6 |
|
Deflection @ Center Error (%) |
0.032 96% |
0.895 1% |
0.774 13% |
0.911 2.2% |
|
My @ Center (K-ft / ft) Error (%) |
80.45 19% |
75.8 12% |
70.3 4% |
73.4 8% |
|
Global MX Reaction @ Center of Long Side to Obtain Max. Local My |
Joint 6 844.8 K-ft |
Joint 15 717.2K-ft |
Joint 18 545.3K-ft |
Joint 4 489.4K-ft |
|
Local My @ Center of Long Side Error (%) |
80.5 k-ft / ft 43% |
136.6 k-ft / ft 3% |
129.8 k-ft / ft 8% |
139.8 k-ft / ft 1% |


The condition being modeled is a flat plate with fixed edges and a uniform load over the entire surface. The RISA-3D2DFloor files that were used to obtain these results are included as “2X2FIXED.R3D”, “4X4FIXED.R3D”, “5X5FIXED.R3D”, and “6X6FIXED.R3D”.
The plate moments at the center of the long side were calculated by dividing the global Mx reaction at the center of the long side by the tributary length. See the summary results below. (Note that the 5x5 mesh produces good results even though the Mx reaction is not at the exact center of the long side.) Remember that plates with perfectly fixed end conditions have their maximum moments at the center edge of their longest side.
|
Mesh |
Mx Global Reaction |
Tributary Length |
Equation |
My Local Moment |
|---|---|---|---|---|
|
2x2 |
844.8 k-ft |
21ft / 2 = 10.5ft |
844.8 / 10.5 |
80.5 k-ft / ft |
|
4x4 |
717.2 k-ft |
21ft / 4 = 5.25ft |
717.2 / 5.25 |
136.6 k-ft / ft |
|
5x5 |
545.3 k-ft |
21ft / 5 = 4.25ft |
545.3 / 4.25 |
129.8 k-ft / ft |
|
6x6 |
489.4 k-ft |
21ft / 6 = 3.5 ft |
489.4 / 3.5 |
139.8 k-ft / ft |
The edge moments only need to be considered as the maximum moments when a plate is fixed at it’s edges, since the maximum moments will often occur in the center of the plate for most other support conditions. (The edge moments will still need to be considered for moment reversal if the plate is continuous across the supports).
For the situation of continuous slabs supported by beams between columns, the maximum moment will often occur at mid span and not at the edges. Thus a 3x3 or 5x5 mesh should be used to obtain correct moments. Even numbered meshes (e.g. 6x6, 4x4, or 2x2) should be used to obtain the best deflection information and odd numbered meshes ( e.g. 3x3 or 5x5) should be used to obtain the best bending moment results. The 6x6 mesh could be used to obtain good moments and deflection results.
The internal My bending moments are obtained using the Global Corner Forces and the Internal Force Summation tool for the 2x2, 4x4, and 6x6 meshes. The total global MX moment on the side of an element was computed and then divided by the length of the element. (Global MX moments are parallel to local My moments in this model) The internal My @ Center are found using the Plate Forces for the odd plate example (5x5) because there is no node at the center.
It should be noted that the deflection obtained from the 4x4 and 6x6 meshes is larger than that predicted by the Roark equations because the RISA-3D2DFloor finite element accounts for transverse shear deformation while the Roark equations ignore shear deformation.
These results are for a uniform load. If the loading is more localized, or approaches a point load, a much finer mesh in the vicinity of the load will be needed to model the loading itself and to get accurate results. Also note that RISA-3D2DFloor’s finite element (like most commercial finite elements) is based on small strain theory. This means that the in-plane diaphragm stresses are not affected when the transverse deflections become large. According to Roark, (pgs. 405-409), this additional stress becomes significant when the transverse deflection is larger than half the plate thickness.
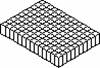
Spread Footing Modeling
Stress Accuracy as a Function of Distortion
Shown below are the analysis results for an axial wall load on a spread footing, which is then on soil springs. The files used for this parametric study are FLXFTNG.R3D for the “flexible” footing results and RGDFTNG.R3D for the rigid footing results. Note that the theoretical values shown are based on the assumption of an infinitely rigid footing.
|
|
|
|
|
|---|---|---|---|
|
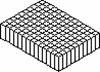
Footing Thickness |
12 in. |
24 in. |
36 in. |
|
Element Ratio Thickness:Length |
1:1 |
2:1 |
3:1 |
|
One way shear at “d” from the wall face, Flexible Footing |
109.2 kips |
92.4 kips |
70 kips |
|
Elements Used for Shear |
9-135 (by 14) |
10-136 (by 14) |
11-137 (by 14) |
|
Moment at Wall Face, Flexible Footing |
368 k-ft |
415.2 k-ft |
421.2 k-ft |
|
Elements Used for Moment |
9-135 (by 14) |
9-135 (by 14) |
9-135 (by 14) |
|
Theoretical 1-Way Shear at “d” from the Wall Face |
117.9 kips |
94.3 kips |
70.7 kips |
|
Theoretical Moment at Wall Face |
424.3 k-ft |
424.3 k-ft |
424.3 k-ft |
As can be seen in the table, the results are converging to the theoretical solution for a infinitely rigid footing as the footing thickness increases and begins to become “very rigid” when compared to the soil spring stiffness.
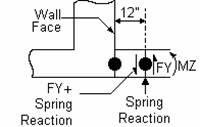
To obtain the One Way Shear values at a distance “d” from the wall face, simply sum the FY global corner force values for the elements on both sides of the appropriate row, and then take the average of these two values. You need to average the two values in this case, because the corner force results are on either side of a soil spring. For example, to obtain the one way shear for the 24” thick footing, sum all the FY corner forces for elements 9 to 135 by 14 (9, 23, 37, …) and then 10 to 136 by 14 (10, 24, 38, …). Then take the average of those two sums. If you don't have soil springs at the corner force locations, you don't have to average the two values. (The sums on each side in this case will be equal). The easiest way to add up the corner forces is to simply sum them from the graphics display. This way you don't have to track the element numbers.
To obtain the Moment values at the face of the wall, just add up the MZ global corner forces for the elements along the wall face. For this example these would be elements 9 to 135 by 14. Again, the easiest way to add up the corner forces is to sum them from the graphics display so you don't have to worry about element numbers.
The finite element corner forces work best when the footing is aligned with the global axes. That way the global corner forces line up with the desired footing shears and moments.
Since the theoretical values for the shear and moment are based on the assumption of an infinitely rigid footing, it is instructive to look at a finite element model where we use an artificially high value of “E” (Elastic Modulus) to approximate an infinitely rigid foundation.
Rigid Footing Results
|
Footing Thickness |
12 in. |
|
1-Way Shear at “d” from the Wall Face, Rigid Footing |
117.9 kips |
|
Elements Used for Shear |
9-135 (by 14) |
|
Moment at Wall Face, Rigid Footing |
9-135 (by 14) |
|
Elements Used for Moment |
9-135 (by 14) |
These results agree exactly with the theoretical values.
Computing Soil Spring Stiffness
Obtain the subgrade modulus for a 1’ by 1’ or .3m. x .3m sample plate. A typical value for medium dense dry sand would be say, k1 = 500 kcf. This value must first be modified to account for our actual footing size (10 ft by 14 ft). For this example we will use equations from Principles of Foundation Engineering, 3rd edition, by Braja Das, pgs. 263 - 264. We will assume a 1ft x 1ft sample plate.

We can now calculate the spring stiffnesses for all the joints in the model based on tributary area.The program is capable of automatically generating these soil springs based on the tributary are of each node in the plate element mesh. Refer to Generating Soil Springs of the Boundary Conditions s section for more information.
|
Tributary Area |
K(10x14) k/in^3 |
K(spring) k/in |
Example Joint |
|---|---|---|---|
|
1 sq.ft = 144 sq.in. |
0.07906 |
11.38 |
13 |
|
0.5 sq.ft = 72 sq.in. |
0.07906 |
5.69 |
34 |
|
0.25 sq.ft = 36 sq.in. |
0.07906 |
2.85 |
1 |
Although a little out of date, the ACI publication 336.2R-88, “Suggested Analysis and Design Procedures for Combined Footing and Mats”, is another good reference for the modeling of mat foundations.
Plate Connectivity Problems
Shown below is a common modeling problem with plate elements. Since plates only have connectivity at their corner nodes, the applied load at middle joint connects to the plates below the joint, but not to the one above it. Because of this lack of connectivity, you see the joint "pushing through" the plate edge above in the plotted deflected shape.
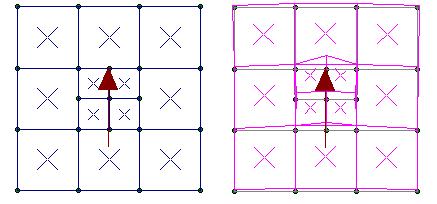
The proper way to hand this type of mesh is with one of the mesh transitions described in the following section.
For additional advice on this topic, please see the RISA Tips & Tricks webpage at risa.com/post/support. Type in Search keywords: Plate Connectivity.
Mesh Transition Examples
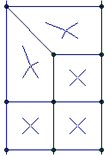
Coarse Mesh to Fine Mesh
Shown below are two methods for transitioning from an area with a fine mesh to an area with a larger / coarser mesh.
|
Three to One |
Two to One |
|
|
Rectangular Mesh to Radial Mesh
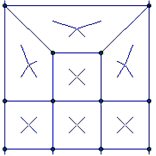
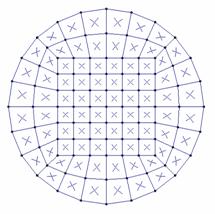
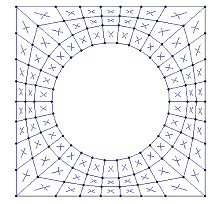
Shown below are two methods for transitioning from an area with a rectangular mesh into an area with a radial mesh.
|
Square to Round |
Round to Square |
|
|
|
For additional advice on this topic, please see the RISA Tips & Tricks webpage at risa.com/post/support. Type in Search keywords: Plate Mesh.